- This topic is empty.
- AuthorPosts
- 18. January 2024 at 9:53 #7457
 Moritz UlmerKeymaster
Graphs and grids, the center of any dashboard. Choosing the right approach to integrate dashboard functionality into your application can make or break the entire user experience. Should you use an off-the-shelf product or is it better to follow a mix-and-match approach? In the first category lie approaches such as integrating Grafana or using one of the hundreds of Angular admin templates. These require less time if they fit into your requirements. Such as having the option of paid, no-strings attached templates. Or even the powerful pre-license change Grafana code base. This approach was ultimately not viable for us due to the limited flexibility afforded by the templates. In addition, mixing Angular and React, in the case of Grafana, is not the best idea.
To highlight the functionality we were going for, see the Figma design below. It shows our requirements from basic ones such as line graphs and time range selectors to our domain specific ones such as controller action buttons and de-/serialization of the dashboard. Secondary requirements such as drag ‘n drop editing the panels as well as collapsible rows are also shown.
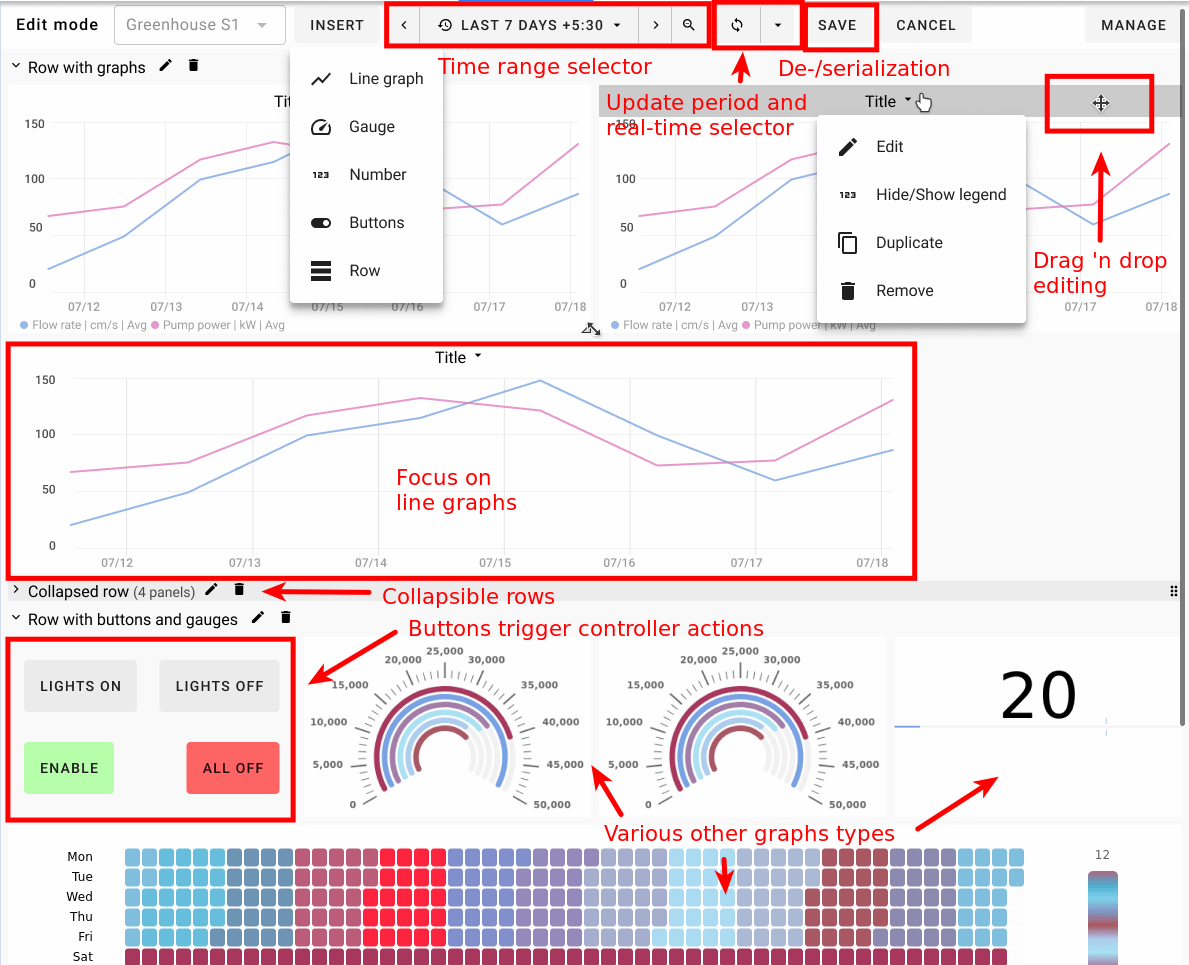
A requirements breakdown of our dashboards with different aspects highlightedTherefore, we were left with the the mix-and-match approach. However, one does not have to start at zero. We found that existing libraries can be utilized to take care of the graphing, grid layout and data de-/serialization needs we had. The libraries that ultimately won us over were:
- Graphs: ngx-echarts
- Grid layout: gridstack
- De-/serialization: JSON Schema
Graphs and Time Series
What unifies the individual graphs of a dashboard together is the time-frame of the displayed data. The data sources and how the data is displayed can be varied between each graph. However, at its core we deal with time series data and this is best visualized with line graphs. This is why when choosing a graph library, the topmost importance had to be that the line graphs were top notch. Only after was the focus placed on what other visualization options it offers.
Aspects that a line graph should handle well can be grouped into axis control, data display and interactivity. On the topic of axis control, a library should allow specifying axis ranges, labels for the axes as well as the gap size of the axes. When talking of data display, supporting null or missing data is functionality that not every library supports. Viewing data points on hover is another requirement that also falls into this category.
Finally, interactivity can make or break a good user experience. It starts with simple aspects such as dynamically resizing charts to being able to zoom and pan across time and value ranges. When it came to zooming, having X-axis zoom does not guarantee that Y-axis zoom works. A significant difference can also be observed between libraries for support on mobile, where touch instead of mouse inputs are used. This is often what differentiates modern from more classic graphing libraries.
Although we had initially chosen ngx-charts for their focus on Angular, we had to reconsider due to their lack of support for null and missing data points which are a common occurrence in IoT applications. After evaluating all of the options, which we’ll outline in a later post, we decided to migrate to Apache ECharts via the ngx-echarts library. And since their names differed only by a single ‘e’, the migration was a simple find and replace operation /s.
Grid Layout and Action Buttons
A single graph does not make a dashboard. A multitude of different sizes, data sources and visualizations are what convey a comprehensive overview. Therefore, being able to tailor a dashboard’s layout is an important aspect of it being easy to use and powerful. The choices here are a bit more limited compared to graph libraries but the initially obvious choice was not finally the best choice.
Functionality that we looked out for included resizing, JSON serialization and elements reacting to each other when being moved. All libraries support this equally well. However, what separated the libraries was their click and drag functionality. In addition we also looked at meta properties such as how active their development was and how easy they were to use.
Gridster2 initially seemed the best option for us, especially as it focused on Angular integration, but ultimately we chose gridstack. The main points were its better click and drag functionality as well as ease of use that was influenced by its documentation. For a full break down, see our dedicated post on the topic.
Data De-/Serialization
Ensuring correctness of the saved data is not necessary, but a highly valuable tool that you only learn to appreciate down the road. As the dashboard section of the web app was the only producer and consumer of the serialized data, a formal data contract is not strictly necessary. However, as different versions of the app will interact with the data they produced, having a specified data structure improves backward compatibility.
The main options here were Protobufs as we already employ them in our backend or JSON Schema which is designed specifically for JSON. In terms of functionality and tooling both would have worked, but the expressiveness of JSON Schema made it the favorite. Being able to define conditional requirements with the anyOf, if/then and dependentRequired keywords allowed valid data to be closely matched with the way data was actually used.
Conclusion
Creating your own dashboard is definitely a feasible task. Especially if customizing it to your domain is an important aspect. But be prepared to spend significant time on its implementation. To make it easier, it’s advisable to create detailed mock-ups of the final product and evaluate libraries before integrating them. And on the process side, when planning the task, break the work down into manageable chunks and aim for the minimal viable functionality to avoid feature creep during implementation.
Authored by

Moritz UlmerManaging Director & Internet-of-Things Specialist
Reviewed by

Ranuka PereraLead Software Developer with a passion for IoT
- AuthorPosts
- The forum ‘Inamata: Development Updates’ is closed to new topics and replies.