Dashboards
Visualize data with IoT Dashboards
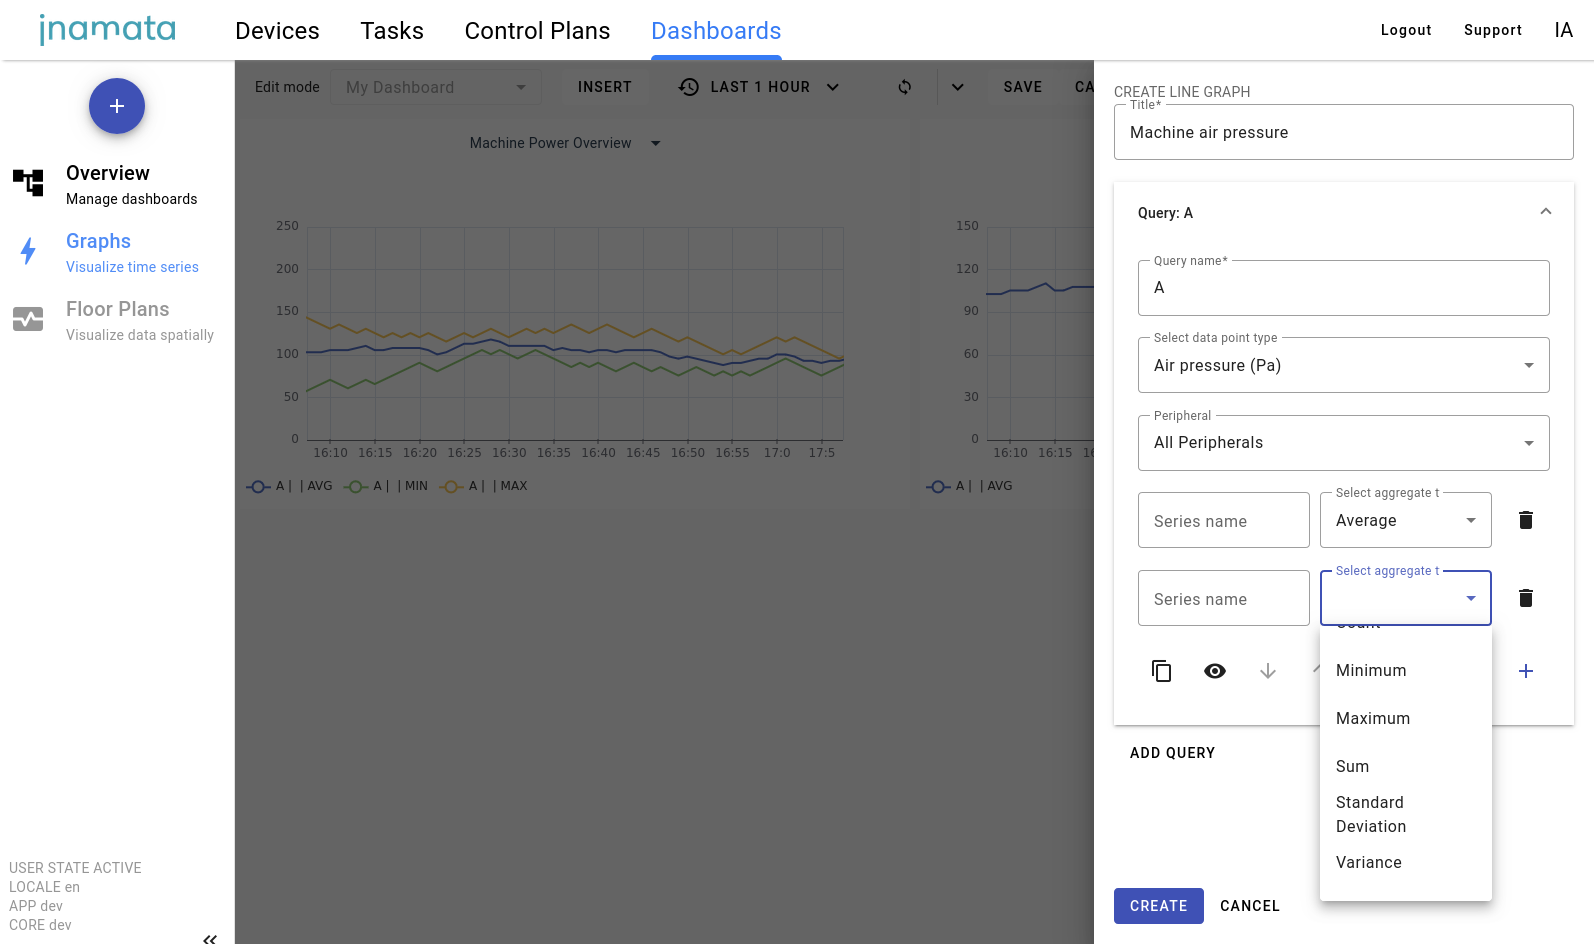
Once you have connected your devices, Inamata is the easiest method to create powerful IoT dashboards. With just a few clicks, select the type of data and the device source, and you will be up and running. Our focus on visually pleasing visualization goes hand-in-hand with showing you what is relevant.
In addition to monitoring, our IoT dashboards allow you to command devices remotely. Add buttons to your dashboards to start and stop pumps, trigger control plans to run complex logic and have an emergency stop switch within reach.
Dashboards leverage your organized data. Use data point types to group all measured data from your various temperature sensors, use formulas to combine it with vibration and power rates and gain insights that would otherwise have taken weeks to acquire. Apply this approach to historical data and see how your machine health is evolving.
The dashboards are inspired by Grafana which acts as the gold standard in dashboards. Where our dashboards go a step further is adding interaction with the devices themselves to command them to power on or change state or their connected peripherals. This deep integration between the different aspects of the platform is a significant advantage an integrated solution brings.
In addition, we offer the development of custom dashboard types. This is useful for white-labeling purposes to sell remote monitoring and control to your customer base. This gives the impression of bespoke software solutions that would otherwise require significant investment and lead time. Reach out to us to see how we can make this a reality.